Visualization in Python - Welcome to the world of data visualization in Python! In an era where data speaks louder than words, having the ability to visualize scientific data effectively is crucial for communication and analysis. Python, a leader in the programming world, offers a vast array of libraries designed to turn raw data into insightful visual stories. Whether you're a scientist, an engineer, or a data analyst, mastering these tools can significantly enhance your data interpretation and presentation skills.
Matplotlib: Going Beyond Basic Charts
check out our YouTube channel videos on Python
Matplotlib is often the first stop in the journey of data visualization with Python. Known for its flexibility and ease of use, Matplotlib allows for detailed customization of plots, enabling users to highlight the nuances of their data.
Case Study: Imagine analyzing climate patterns over the last century. With Matplotlib, not only can you plot these trends over time, but you can also overlay different data points, such as volcanic eruptions or El Niño events, to see how they impact climate changes. This multi-axis plotting capability allows for a comprehensive analysis in a single figure.
Seaborn for Statistical Data Visualization
Moving on to Seaborn, which builds on Matplotlib's foundation, it integrates closely with pandas data structures and offers a more visually appealing and statistically oriented approach to plotting.
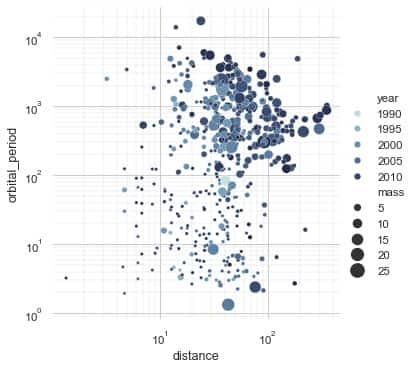
Example: When dealing with medical data, such as patient blood samples, Seaborn’s pairplot function can be invaluable. It automatically plots pairwise relationships in a dataset, letting you instantly spot correlations and distributions, and potentially even diagnose patterns indicative of diseases.
Plotly for Interactive Visualizations

For data that demands interactivity, Plotly stands out. It enables the creation of sophisticated dynamic visualizations that are web-friendly and highly interactive, ideal for presentations or online dashboards.
Case Study: Consider a dashboard for COVID-19 cases and vaccination rates. Using Plotly, you can build an interactive chart that updates in real-time as users select different regions or time frames, providing a powerful tool for understanding the pandemic's trends.
3D Visualization with Mayavi
Mayavi is a tool that excels in 3D data visualization, offering stunning visual clarity for complex scientific data, from fluid dynamics to quantum physics simulations.
Example: Visualizing air flow around an aircraft in three dimensions can provide engineers with insights into improving aerodynamics and performance, something that 2D plots simply can't match.
Geospatial Data Analysis with GeoPandas and Folium
GeoPandas extends the functionalities of pandas to allow spatial operations on geodataframes, while Folium brings these analyses to life through interactive maps.
Case Study: Environmental scientists studying deforestation can use these tools to plot changes in forest cover over time on a map, providing a clear visual representation of the data and making it easier to communicate the urgency of conservation efforts.
Animations in Python
Animations can bring static data to life, showing changes over time in a compelling way. Tools like Matplotlib and Celluloid make it possible to create engaging animations that can illustrate concepts like the progression of a chemical reaction or population growth.
Example: Animating the spread of a virus across a country can provide public health officials and the public with a clear understanding of how rapidly the situation is changing.
Advanced Customization Techniques
Finally, advanced customization techniques can polish your visualizations to make them publication-ready. Python offers extensive customization options that can help you match the style and aesthetics of your visuals to your publication or presentation needs.
Tips and Tricks: From choosing the right color palettes to adjusting the transparency of plots to overlay data without losing clarity, these little tweaks can significantly enhance the impact of your visualizations.
Wrapping Up
In conclusion, Python's visualization tools offer powerful solutions tailored to a wide array of scientific data analysis needs. By selecting the appropriate tool—whether it's for static, interactive, or animated visualizations—you can uncover and communicate complex data insights more effectively. As you continue your data visualization journey, remember that the key to success lies in not just using these tools, but mastering them to tell the most compelling visual stories with your data.
References and Further Reading
To further enhance your understanding and skills in data visualization, consider exploring the following resources:
- "Python Data Science Handbook" by Jake VanderPlas
- "Storytelling with Data" by Cole Nussbaumer Knaflic
- Online courses from platforms like Coursera and edX that specialize in Python visualization techniques.
- One of the best free website HERE
For help in modelling in any FEA, FDTD, DFT Simulation / Modelling work, you can contact us (bkacademy.in@gmail.com) or in any platform.
Interested to Learn Engineering modelling? Check our Courses?
check out our YouTube channel
u can follow us on social media
Share the resource
-.-.-.-.-.-.-.-.-.().-.-.-.-.-.-.-.-.-
© bkacademy

One reply on “Introduction to Visualization in Python”
[…] healthcare, AI-enhanced photonic technologies could revolutionize diagnostic methods. For example, photonic sensors integrated with AI can analyze biological tissues with unprecedented precision and speed, […]