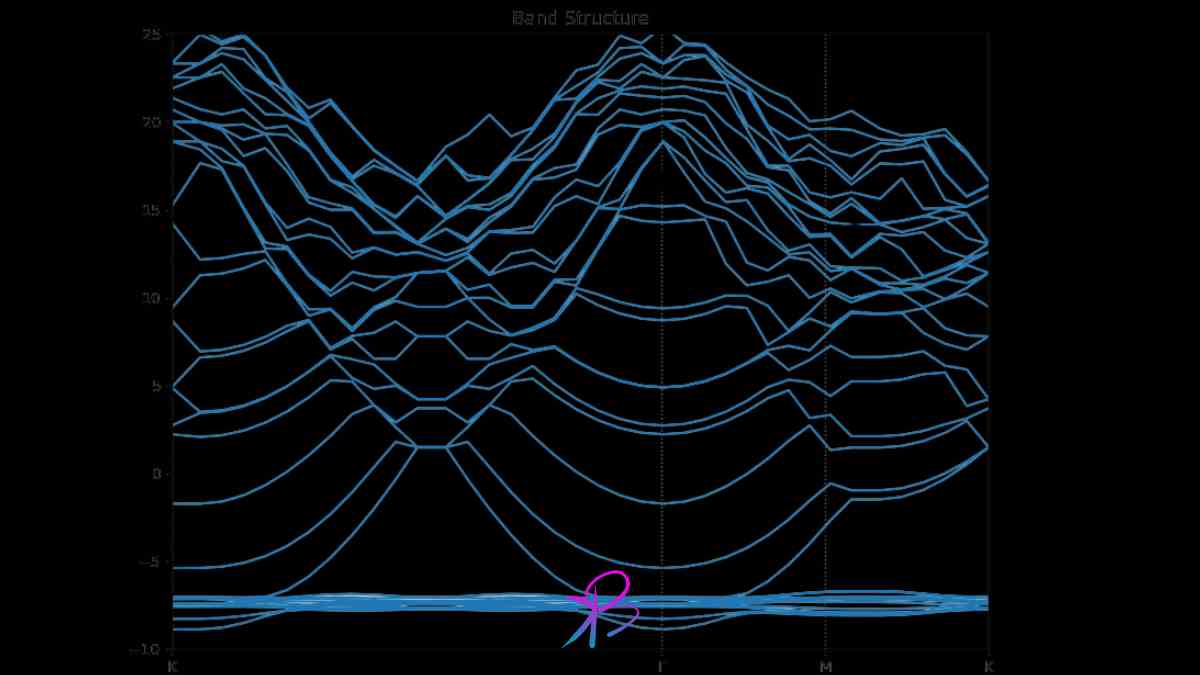
Band Diagram in Python - Hey there! Ever wondered how the tiny components in your gadgets work so smoothly? It's all about understanding the materials they're made from, specifically how electrons move through these materials. That’s where band diagrams come into play. These diagrams are crucial for designing everything from your smartphone to solar panels. Today, we're going to keep it simple with the nearly free electron model—a great starting point for beginners 😊.
Setting Up Your Python Environment
First things first, we need the right tools for our project. We’re going to use some handy Python libraries—think of them as apps that help us do specific tasks. We'll need:
- NumPy: Great for handling numbers and calculations.
- Matplotlib: This one helps us draw all those cool graphs.
- SciPy (optional): Adds some extra power for more complex math.
To get everything set up, open up your command line (don't worry, it's not as scary as it sounds) and type:
pip install numpy matplotlib scipyThis command is like telling your computer to grab these tools and get them ready for us to use.
Theoretical Background
Alright, let's get a bit theoretical but I promise to keep it light. In any material, electrons can only occupy certain energy levels. The zones where they can move freely are called bands. We'll focus on two main things:
- Brillouin zone: This is essentially the playground where electrons can run around. It's defined by the material's structure.
- Band gap: Imagine this as a wall in our playground. Electrons need extra energy (like a good jump) to get over this wall from the valence band (where they usually hang out) to the conduction band (where they start conducting electricity).
Implementing the Model in Python
Now, we get into the coding bit. We’ll define some constants and parameters that describe our material. For instance, we need the lattice constant, which tells us about the spacing between atoms, and we need the mass of an electron.
Here's a snippet to start with:
# Constants
hbar = 1.0545718e-34  # Planck's constant h-bar in joule-seconds
m_e = 9.10938356e-31  # Mass of an electron in kilograms
a = 1e-10  # Lattice constant in meters (an example value)
Coding the Band Diagram
It's time to write the code that'll generate our band diagram. We'll calculate the energy for different values of the wave vector k, which represents the electron's momentum in our playground:
import numpy as np
import matplotlib.pyplot as plt

# Define the wave vector k
k_points = 100
k = np.linspace(-np.pi/a, np.pi/a, k_points)  # From -pi/a to pi/a

# Calculate energy using the nearly free electron model
E = hbar**2 * k**2 / (2 * m_e)

# Plotting the energy bands
plt.figure(figsize=(10, 6))
plt.plot(k, E, label='Conduction Band')
plt.xlabel('Wave Vector k (1/m)')
plt.ylabel('Energy (Joules)')
plt.title('Band Diagram of a Nearly Free Electron Model')
plt.legend()
plt.show()
Interpreting the Results
Once you run the script, you'll see a graph showing how the energy of electrons increases with increasing wave vector. This graph tells us about the electron dynamics in the material and can help predict properties like electrical conductivity and optical absorption.
Want to learn how to plot electronic band diagram in Python ? check the Youtube video
Advanced Topics (Optional)
Feeling brave? Let's tweak our model to explore different scenarios. You can adjust the lattice constant, add multiple bands, or even simulate how impurities affect the band structure. This is your playground now—experiment and see what new insights you can uncover!
Conclusion
And there you go! You’ve just created your very own band diagram using Python. Not too tough, right? With these tools and knowledge, you can dive even deeper into material science and uncover more secrets hidden in the quantum world. Keep exploring and who knows what you might discover next!
Feel free to share your findings or ask questions. Happy coding, and stay curious! 🌟🔬
For help in modelling in any FEA, FDTD, DFT Simulation / Modelling work, you can contact us (bkcademy.in@gmail.com) or in any platform.
Interested to Learn Engineering modelling? Check our Courses?
check out our YouTube channel
u can follow us on social media
Share the resource
-.-.-.-.-.-.-.-.-.().-.-.-.-.-.-.-.-.-
© bkacademy
