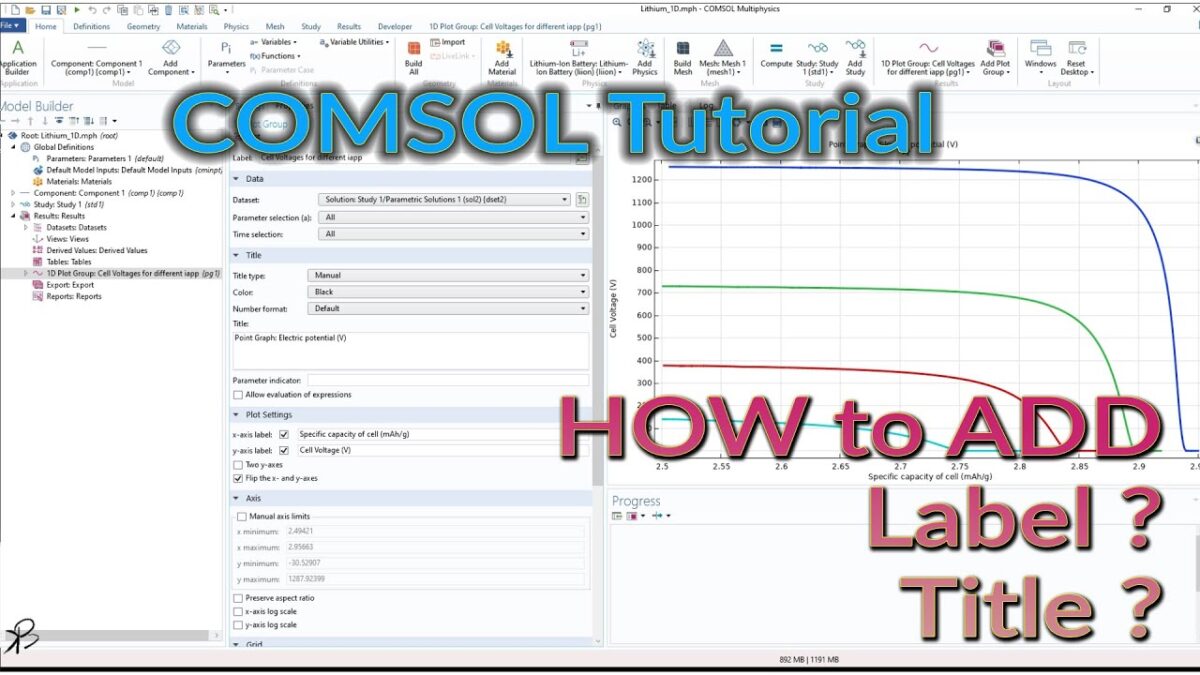
COMSOL Plot adding Titles and Labels - COMSOL Multiphysics is renowned for its powerful visualization capabilities, especially when presenting simulation results. A YouTube video titled "How to Add Title and Labels in a Plot Group in COMSOL Multiphysics" offers a focused tutorial on enhancing the clarity and informativeness of plot groups. This blog post summarizes the key instructions from the video, guiding users on how to effectively add titles and labels to their plots in COMSOL Multiphysics.
Steps for Customizing Plot Groups
The video provides a step-by-step process for adding and customizing titles and labels in a plot group, which is essential for making your plots more understandable and professionally presented.
Check Youtube Link here:
Adding Labels to Axes
- Selecting the Plot Group: Begin by choosing the 1D plot group in your COMSOL project.
- X-Axis Label: Click on the X-axis label section to add a label. For example, the instructor uses 'Specific capacity of cell in mAh per gram'.
- Y-Axis Label: Similarly, enable the Y-axis label and add an appropriate label, such as 'Cell Voltage (V)'.
Interested to Learn Engineering modelling? Check our Courses?
Setting Up the Title
- Accessing Title Settings: Open the title settings in the plot group.
- Choosing Manual Title: Select the 'Manual' option for the title type. This allows for custom text to be entered.
- Entering Title Text: Type in the desired title for your plot. In the example, 'Cell Voltage' is used.
Importance of Clear Titles and Labels
- Enhanced Clarity: Properly labeled axes and a clear title make the plot easier to understand, especially for those who are viewing your results for the first time.
- Professional Presentation: Well-labeled plots are crucial for presentations and publications, where clear communication of data is essential.
Conclusion and Future Lectures
The video concludes with a preview of upcoming lectures, indicating that future tutorials will cover creating additional plot groups and plotting other variables, such as oxygen concentration. This tutorial is part of a series aimed at providing comprehensive guidance on post-processing results in COMSOL Multiphysics.
In conclusion, this YouTube tutorial offers valuable insights into enhancing the presentation of simulation results in COMSOL Multiphysics. By adding custom titles and labels to plot groups, users can significantly improve the readability and professional appearance of their simulation data.
For help in modelling in any FEA, FDTD, DFT Simulation / Modelling work, you can contact us (bkcademy.in@gmail.com) or in any platform.
Interested to Learn Engineering modelling? Check our Courses?
u can follow us on social media
Share the resource
-.-.-.-.-.-.-.-.-.().-.-.-.-.-.-.-.-.-
© bkacademy
